
Recallab › Blog › Pharmacology graphs for NEET PG: six curves and the one question to ask of each
Pharmacology graphs for NEET PG: six curves and the one question to ask of each
Pharmacology graphs look like a lot of lines. Most questions built on them turn on one feature: where a curve sits, how high it reaches, or what shape it falls in.
Register to practise NEET PG pharmacology questions →Free account, no card needed.
The same few graphs come up again and again in NEET PG: log dose-response curves, quantal curves for effect and toxicity, and plasma concentration against time. Each has one question that settles most items built on it. Below are six real Recallab MentorQs, each on a graph. Try each before you open the answer.
Before any graph: three questions
- What is on each axis? Log dose or plain dose, a linear or a log scale, response in one patient or the percentage of a group responding.
- What is each line? A drug, the same drug with something added, or a second effect of the same drug.
- Which feature is asked about? Position (left or right), height (the ceiling), shape (straight or curved) or time (when it levels off).
Dose-response curves: position and ceiling
On a log dose-response curve, **potency is read along the dose axis and efficacy up the response axis**. A curve further to the left needs less drug for the same effect, so the drug is more potent. A curve that stops lower has less efficacy, whatever the dose. The two are independent. A partial agonist is the drug with the lower ceiling: a weak agonist on its own, but given with a full agonist at a high concentration it takes up receptors and the response falls.
Recallab example 1 · antagonist shift
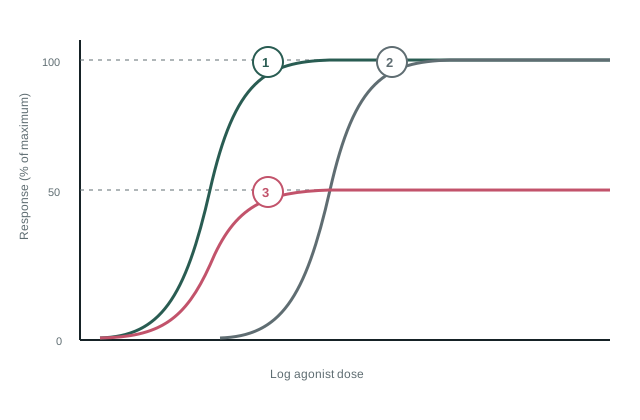
An agonist is plotted in the figure alone and again in the presence of two different antagonists. Which antagonist produced curve 3?
Look first: check the top of each curve before you look at how far it has moved.
 View larger ↗⤢ Tap to enlarge
- AAn inverse agonist
- BA non-competitive antagonist
- CA competitive antagonist
- DA partial agonist
Show the answer and explanation
Answer: B. A non-competitive antagonist
Rule: a lowered ceiling means receptors have been taken out of play. Curve 3 starts where curve 1 does but cannot reach the maximum at any dose. An antagonist that binds away from the agonist's site, or binds irreversibly, does this, and extra agonist cannot compete it off.
Why the closest rival loses: a competitive antagonist (C) is curve 2: shifted right, parallel, with the same maximum, because enough agonist outcompetes it. A partial agonist (D) gives a response of its own rather than capping another drug's curve; an inverse agonist (A) pushes activity below baseline, which no curve here does.
Recallab question 55016 · Pharmacology › General Pharmacology · reference: Katzung's Basic & Clinical Pharmacology
Recallab example 2 · spare receptors
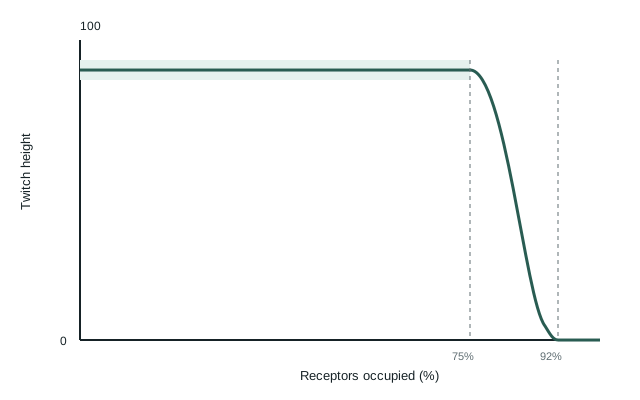
A curve is drawn in the figure relating twitch height to the percentage of neuromuscular receptors occupied by a competitive blocking drug. At what occupancy does twitch height first begin to fall?
Look first: find where the line first leaves the plateau, not where it reaches zero.
 View larger ↗⤢ Tap to enlarge
- AFrom the first receptor occupied
- BAbout 75 per cent
- CAbout 50 per cent
- DAbout 92 per cent
Show the answer and explanation
Answer: B. About 75 per cent
Rule: a flat start is spare receptors. Most neuromuscular receptors are spare, so a competitive blocker must occupy about three quarters of them before the twitch weakens at all. That flat stretch is the junction's margin of safety. Past it, the twitch falls steeply, to nothing by about 92 per cent.
Why the closest rival loses: 92 per cent (D) is where the twitch reaches zero, not where it starts to fall. At 50 per cent (C) the line is still flat, and it is flat from the first receptor occupied (A), not falling in proportion.
Recallab question 56325 · Pharmacology › Drugs acting on the peripheral nervous system · reference: Katzung's Basic & Clinical Pharmacology
Quantal curves: how safe is the dose?
Recallab example 3 · quantal curves
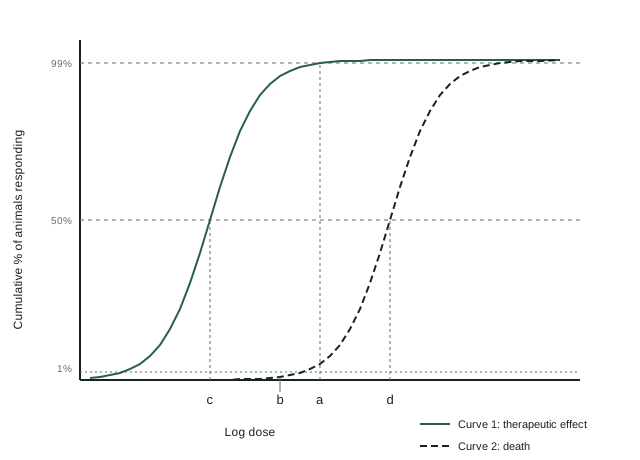
In animal studies of a new drug, the quantal curves for its therapeutic effect and for death are plotted in the figure, with four doses marked a to d. Which ratio is the certain safety factor?
Look first: name each letter first: which curve, and at what percentage?
 View larger ↗⤢ Tap to enlarge
- ADose c divided by dose b
- BDose d divided by dose c
- CDose b divided by dose a
- DDose d divided by dose a
Show the answer and explanation
Answer: C. Dose b divided by dose a
Rule: the certain safety factor is LD1 over ED99. Dose a is where the therapeutic curve reaches 99 per cent, the ED99. Dose b is where the death curve lifts to 1 per cent, the LD1. So the answer is b over a. Here b lies left of a: the ratio is below 1, and the tails of the two curves overlap.
Why the closest rival loses: d over c (B) is LD50 over ED50, the therapeutic index. It uses the middles of the curves, which hide how far their tails overlap. c over b (A) turns the comparison upside down, and d over a (D) mixes a middle with an extreme.
Recallab question 58028 · Pharmacology › General Pharmacology · reference: Goodman & Gilman's The Pharmacological Basis of Therapeutics
Concentration against time
Before reading a concentration-time graph, check the scale on the concentration axis. On a linear scale, a constant fraction lost per hour draws a curve, and a constant amount lost per hour draws a straight line.
Recallab example 4 · order of elimination
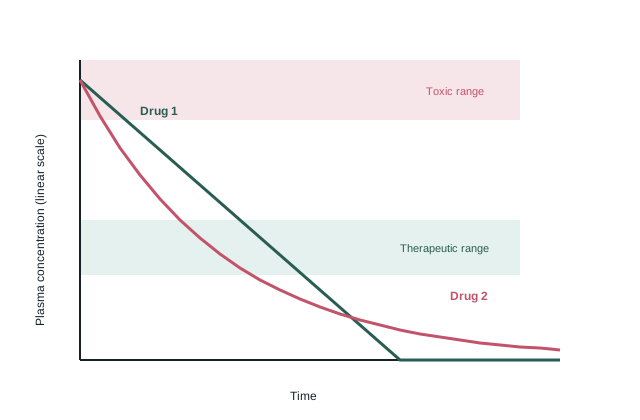
Two drugs' plasma concentration is drawn in the figure over time on the same axes, one falling as a straight line that flattens once it reaches the axis, the other falling as a curve that flattens gradually without quite touching it. Drug 2 follows first order kinetics throughout. What happens to its half-life as its concentration falls?
Look first: is the fall a straight line or a curve? That tells you amount or fraction.
 View larger ↗⤢ Tap to enlarge
- AIt shortens steadily
- BIt varies with the dose given
- CIt stays constant
- DIt lengthens steadily
Show the answer and explanation
Answer: C. It stays constant
Rule: a curve on a linear scale is first order, and its half-life is constant. Drug 2 loses a constant fraction each hour, so it takes the same time to halve at any level. Drug 1's straight line is zero order: an equal amount is lost every hour, and there is no fixed half-life.
Why the closest rival loses: the time to halve does shorten as the level falls (A), but only for drug 1, and that is why drug 1 is not first order. A first-order half-life is set by clearance and volume of distribution, not by the dose (B), and it does not lengthen (D).
Recallab question 56228 · Pharmacology › Pharmacokinetics · reference: Katzung's Basic & Clinical Pharmacology
Recallab example 5 · steady state
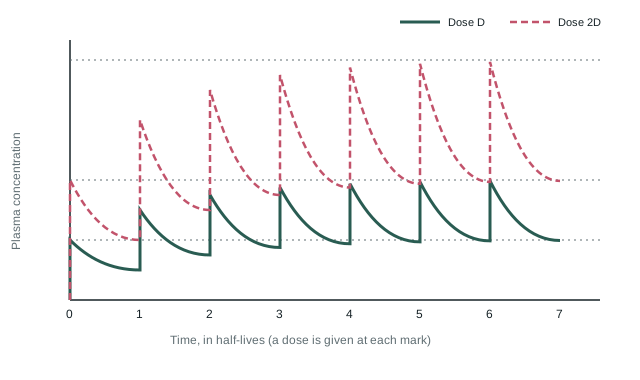
A drug is given as the same dose once every half-life, and its plasma concentration is drawn in the figure against time, with a second curve for twice the dose. After about how many half-lives is steady state reached?
Look first: ignore how high each plateau is; count the doses until the peaks stop rising.
 View larger ↗⤢ Tap to enlarge
- AFour to five
- BOne
- CTen
- DTwo
Show the answer and explanation
Answer: A. Four to five
Rule: steady state takes four to five half-lives, whatever the dose. Each half-life closes half the remaining gap to the plateau: half after one, three quarters after two, about 94 per cent after four and 97 after five. Doubling the dose doubles the height of the plateau, not the time to reach it.
Why the closest rival loses: after two half-lives (D) the curve is only three quarters of the way there, and after one (B) only halfway. By ten (C) the curves have long since levelled off.
Recallab question 55516 · Pharmacology › General Pharmacology · reference: Katzung's Basic & Clinical Pharmacology
Recallab example 6 · loading dose
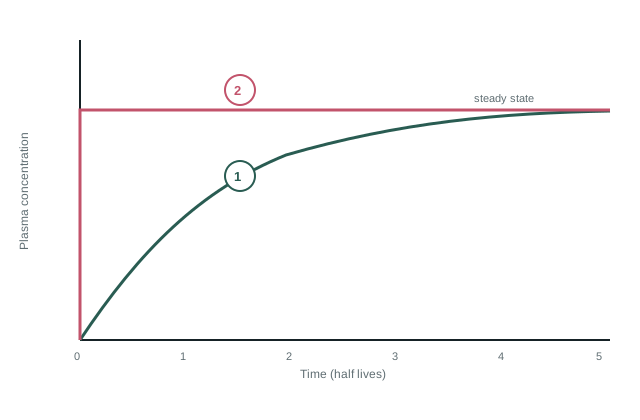
The same maintenance infusion is plotted twice in the figure, once with a loading dose given first and once without. Which parameter decides the size of the loading dose?
Look first: both curves end on the same line. So what does the loading dose change?
 View larger ↗⤢ Tap to enlarge
- AHalf life
- BBioavailability
- CClearance
- DVolume of distribution
Show the answer and explanation
Answer: D. Volume of distribution
Rule: load for the volume, maintain against the clearance. The loading dose is the target concentration multiplied by the volume of distribution: it fills that volume at once. The steady-state level is the infusion rate divided by clearance, and neither has changed, so curve 2 reaches the same line as curve 1, only sooner.
Why the closest rival loses: clearance (C) sets the steady-state level and the maintenance rate, not the load. Half life (A) decides how long the unloaded curve takes to get there; bioavailability (B) scales any oral dose alike.
Recallab question 55017 · Pharmacology › General Pharmacology · reference: Tripathi, Essentials of Medical Pharmacology
The one-minute routine
| If you see | Ask first | It usually settles |
|---|---|---|
| Two dose-response curves | Is one further left, or higher? | Potency (left) or efficacy (higher) |
| An agonist curve with an antagonist | Did the ceiling move? | Competitive (no) or non-competitive (yes) |
| Response against receptors occupied | Where does the plateau end? | Spare receptors and the margin of safety |
| Two quantal curves | Which percentage is each letter at? | Therapeutic index (50 over 50) or certain safety factor (1 over 99) |
| Concentration falling on a linear scale | Straight line or curve? | Zero order (constant amount) or first order (constant fraction) |
| Repeated doses | When do the peaks stop rising? | Steady state in four to five half-lives, whatever the dose |
| An infusion with and without a load | Do both end on the same line? | Loading dose from volume, steady state from clearance |
For charts and tables in community medicine, see biostatistics without fear: six NEET PG chart questions. For other kinds of figure, see ten NEET PG image questions. For the curves of physiology, from oxygen dissociation to renal clearance, see six NEET PG physiology graphs. When you miss one, see how to review a wrong answer.
Why candidates use Recallab
- Built towards 22,000 — a batch at a time
- Illustrations drawn for the question
- Every option explained, not just the right one
- AI study tools that are live today
- Start free, today
Or see the plans, or try a timed mock section.
Register to practise NEET PG pharmacology questionsFree account, no card needed. Practise with every option explained and a reference on every question.Drawn from questions #55016, #56325, #58028, #56228, #55516, #55017, #50827, #53517 in the Recallab bank, each with its own verified answer and current-edition reference. Last reviewed 26 September 2026.